
AutoGLM
The "think while you do" revolution of domestic AI Agents, reconstructing the intelligent execution experience with two-end collaboration
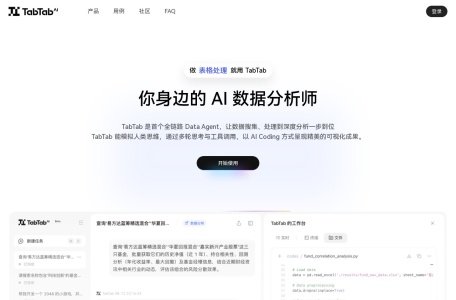
The full-link Data Agent revolution makes "everyone an analyst" a reality
When the total global data volume is about to exceed 180ZB by 2025, of which 80% is unstructured content, the traditional data analysis system is in an unprecedented predicament: the lengthy link from ETL data extraction to front-end report generation has seriously sunk the value of data in the “manual number finding + manual analysis” model; Structured data is blocked by layers of technical barriers, and only a few decision-makers can reach it at high cost. The insufficient processing capacity of unstructured information makes it difficult for enterprises to capture business opportunities from massive user feedback and industry dynamics. TabTab launched by Lingkuai Technology reconstructs the data analysis logic with a full-link data agent, and realizes “semantics as a service, dialogue as analysis, and insight as action” through a multi-agent collaborative system, completely breaking the shackles of technology and opening a new paradigm of Vibe Data Analysis.
The disruptive value of TabTab lies in upgrading data analysis from “reactive response” to “proactive service”, building competitive barriers through three core innovations, and transforming data from “weekly report charts” to “conversational decision-making” as the core driving force.
Unlike ordinary chatbots that can only handle a single link, TabTab has built an AI composed of planning and execution agents, data science agents, long text report writing agents, etc team to automate the entire process from data acquisition to insight output. Users only need to put forward requirements in natural language, and the system will independently plan the task path: the DB Agent connects with the data source to complete the data extraction, the Data Science Agent performs cleaning modeling and statistical analysis, the Program Agent automatically generates visual charts, and finally the report writes the Agent’s output analysis results with insights. For example, when proposing to “analyze user evaluation trends in the beauty category in the past three months”, TabTab will automatically capture e-commerce platform review data, clean invalid information, identify core evaluation dimensions, generate trend line charts through sentiment analysis, and refine key insights such as “declining satisfaction with moisturizing effects” and “high-frequency praise for packaging design”, without manual intervention.
The breadth of data source coverage determines the depth of data analysis, and TabTab has a unique advantage in data source construction: it not only supports the acquisition of public domain data through Deep Research, but also realizes the comprehensive integration of private domain and vertical field data. The private domain is compatible with various databases and file formats such as Feishu Forms, MySQL, and PostgreSQL, allowing enterprises to directly access internal business data. In the vertical field, professional data sources such as IT Orange Venture Capital Data, Tianyancha, and Huge Qianchuan have been integrated to meet the accurate analysis needs of different industries. This global coverage capability of “public domain + private domain + vertical field” allows TabTab to break the limitations of traditional data analysis data sources, provide retail enterprises with 3D analysis of “competitive product pricing + own sales + user evaluation”, and generate in-depth reports of “industry trends + corporate financing + team background” for venture capital institutions.
“Data accuracy” is the lifeline of analytical decision-making, and TabTab achieves the goal of “100% accuracy, 0 illusions” by building a dedicated semantic layer. This semantic layer accurately maps the business terminology, metric system, and raw data of enterprises into a context that large models can understand, which can not only identify general business indicators such as “GMV” and “repurchase rate”, but also adapt to personalized “black words” in different industries, such as “SKU sales rate” in the e-commerce field and “non-performing loan rate” in the financial field. When a user asks about “weekly sales changes of core SKUs”, the semantic layer will automatically match the corresponding data source fields and calculation logic to avoid analytical biases caused by terminology ambiguity, which makes TabTab irreplaceable in enterprise-level data analysis scenarios.
Focusing on the core logic of “data-analysis-insight-decision-making”, TabTab has created a functional system covering all scenarios, simplifying complex data analysis processes into natural language dialogue, making it easy for non-technical personnel to navigate.
TabTab completely overturns the technical threshold of traditional data analysis, allowing users to complete all operations with just everyday language without mastering SQL programming, formula editing, or modeling skills. Whether it’s basic queries like “comparing sales performance in Q2 regions” or advanced analytics like “predicting user growth trends in the next quarter using linear regression,” the system can accurately understand and execute them. For users who lack a clear direction for analysis, TabTab can also proactively provide suggestions: after entering “Analyze the performance of newly launched products”, the system will automatically recommend dimensions such as “sales trend analysis, user evaluation insights, and comparative analysis of competitors” to guide users to explore the value of their data.
Data insights need to be presented intuitively, and TabTab supports various chart types such as pie charts, bar charts, and line charts through AI coding technology, which can automatically match the optimal visualization format according to the analysis scenario – such as using a combination chart to show the “monthly change in sales volume and profit” and a scatter plot to present the “correlation between customer unit price and repurchase rate”. What’s more, the system can generate multi-format reports with one click, whether it is a PPT for internal meetings, a PDF of foreign exchange reports, or a web version for online sharing, keeping the data and charts updated synchronously. This seamless integration of “analysis-visualization-reporting” reduces the report production cycle that originally took several days to minutes.
As an “AI data analyst that evolves autonomously”, TabTab has the ability to continuously learn: by memorizing users’ analysis habits, common indicators, and correction feedback, it continuously optimizes task planning and analysis logic, and the more it is used, the more it meets the needs of users. At the same time, the system supports two manual intervention modes, active and passive, when the analysis involves complex decision-making scenarios, users can pause the automatic process and manually adjust the scope of data sources or analysis dimensions. For routine analysis tasks, the system performs autonomously throughout the process, and this balanced design of “AI autonomous evolution + human decision-making” not only ensures efficiency, but also takes into account the flexibility of analysis.
From the Internet to manufacturing, from marketing operations to business decision-making, TabTab has been applied in many fields and has become a core tool for enterprises to improve data productivity.
The problem of “difficulty in capturing user needs” faced by retail enterprises has been solved with the help of TabTab. By analyzing unstructured data such as cross-platform product reviews and customer service records, the system can quickly identify users’ core demands for products – for example, a beauty brand found that “suitable for sensitive skin” and “wearing makeup for more than 8 hours” are the demand points frequently mentioned by users, and optimize product formulas and selling point designs accordingly, increasing monthly sales by 30% after launch. At the same time, TabTab can also monitor the dynamics of competitors, capture real-time pricing adjustments, promotions and other information of competitors, and provide enterprises with accurate response strategy suggestions.
In intelligent marketing scenarios, TabTab can build a predictive model based on user behavior data, accurately delineate target groups such as “high repurchase potential groups” and “high churn risk users”, and automatically match personalized rights and content matrices. An e-commerce platform found through TabTab analysis that “young female users who have not repurchased for 30 days” have the highest response to the combination of “beauty samples + full discount coupons”, and based on this, targeted marketing has increased the repurchase rate by 22%. In addition, the system can also track the effect of multi-channel marketing in real time, identify the optimal path of “Xiaohongshu grass planting →Tmall conversion”, and provide data support for enterprises to optimize budget allocation.
While traditional decision-making relies on fixed-cycle reports, often leading to “missed opportunities”, TabTab realizes dynamic adjustment of decisions through real-time data access. A manufacturing company used TabTab to monitor raw material prices and inventory changes, and when the system found that “steel prices rose by 5% for a week”, it immediately issued an early warning and suggested “locking in the next month’s purchase volume in advance”, helping the company avoid the risk of subsequent 10% cost increase. This closed-loop capability of “real-time monitoring, automatic early warning, and decision-making suggestions” allows enterprises to shift from passive “post-review” to active “pre-prediction”, significantly improving market response speed.
The emergence of TabTab is not only an innovation in a tool, but also a reconstruction of the underlying logic of the data analysis industry. It breaks the technical barriers of traditional data analysis with a multi-agent architecture, solves the problem of data silos with global data source access, ensures the reliability of analysis with accurate semantic layers, and finally realizes the efficiency revolution of “1 employee + 3~5 AI Agents equivalent to 10 employees”.
For small and medium-sized enterprises, TabTab does not require high data warehouse construction costs, and can quickly have enterprise-level data analysis capabilities through the SaaS version. For professional analysts, it frees people from tedious data processing and focuses on insight refinement and decision-making recommendations; For the entire industry, the new paradigm of Vibe Data Analysis is driving data analysis from “expertise for a few” to “productivity tools available to everyone.”
As Lingkuai Technology completes the angel round of financing and accelerates technology iteration, TabTab will further expand overseas markets and deepen its integration with vertical industries in the future. It is foreseeable that this full-link data agent will continue to break down the barriers to data value release, allowing more organizations and individuals to enjoy the dividends of data equality, and reshaping the value boundaries of data analysis in the era of generative AI.